¶ 1) To Start KITS

Navigate to your desktop and double-click the ‘KITS’ icon. If you need to create a desktop shortcut, navigate to C:\Program Files (x86)\Kimley-Horn\KITS\KITSCS, right click on ‘KITS_CS.exe’, select create shortcut and move this to your desktop.
¶ 2) Adding an Intersection and Defining Map Presets
Open the KITS Map and click the ‘Add Device’ button on the left side of the Map ribbon. You can also right-click on the map and select ‘Add Intersection’. Follow each step in the KITS Device Setup wizard to add the intersection to KITS. To add a map preset, zoom to the preferred location and click the ‘Add’ button. Click the ‘Select Preset’ dropdown and select a preset to zoom the map to that location.

¶ 3) View Timing Values and Create Graphics
Select an intersection from the Intersection List, click the ‘Intersections’ tab and select ‘Timing Values’ under the ‘Real-Time’ menu.

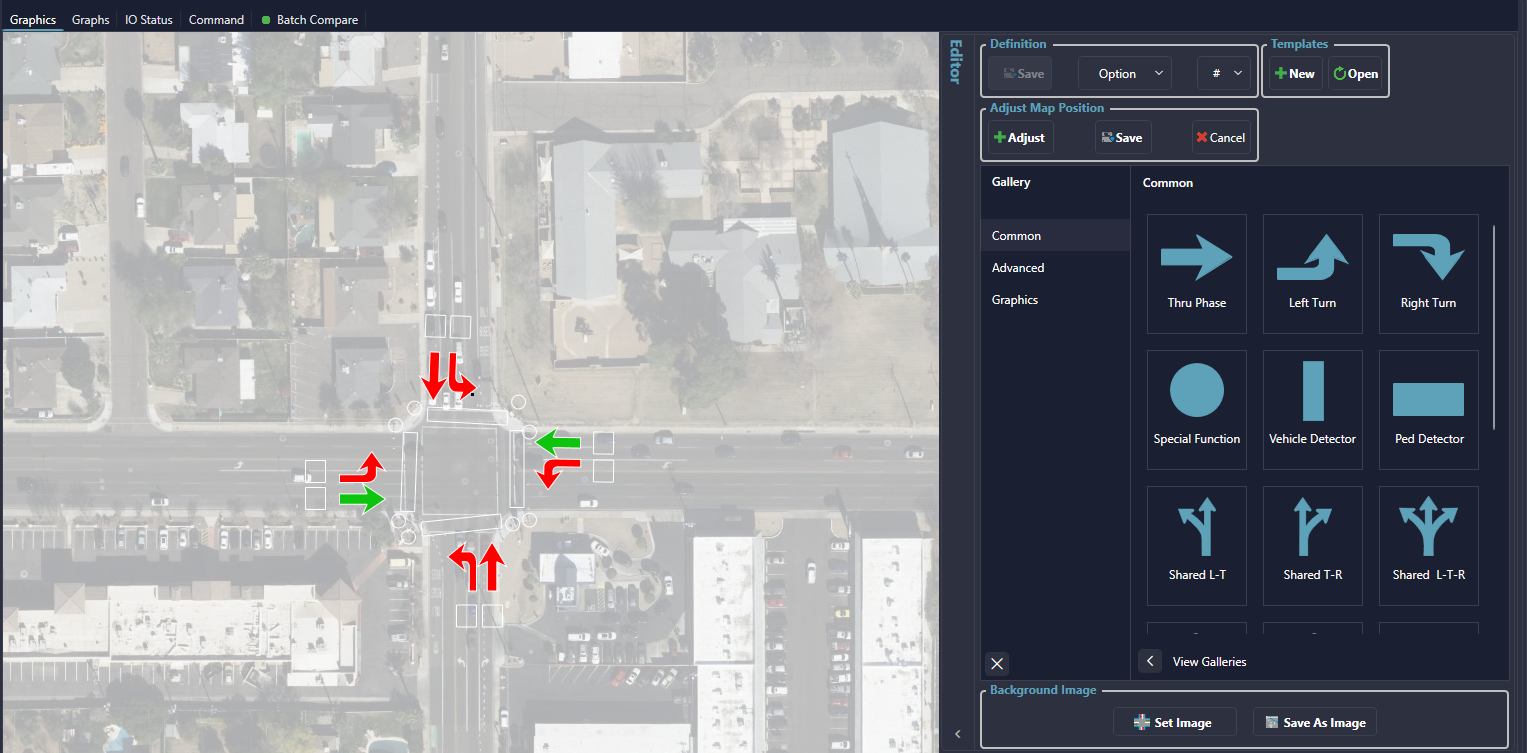
To create graphics, click the ‘Editor’ sidebar on the right-hand side of the Timing Values Graphics. Drag and drop graphics elements onto the map and click the ‘Option’ dropdown to associate elements with a phase actuation, detector call, special function, etc.

¶ 4) Historical Intersection Timing Data and Event Log
Click the ‘Intersections’ tab and click the ‘History Reports’ button to see a list of available reports. Click ‘Event Log’ and select the preferred extents to generate a report of any KITS events. Click ‘Historical Intersection Timing Report’ and select the preferred extents to view a graphical representation of the controller’s phase timing over each cycle.

¶ 5) Viewing Alerts
The KITS Alert Viewer is docked along the bottom of the KITS UI. Enter criteria into the Search field or configure column filters to narrow down the list of alerts. Click the ‘Realtime Status’ button to pause Alert Viewer updates and allow grouping by columns. Right-click on an alert to acknowledge, remove or view more information for the alert.
¶ 6) Controller Pages
Select an intersection from the Intersection List, click the ‘Intersections’ tab and click the corresponding controller type button under ‘Controller Database’ to open the controller database pages for that intersection.
¶ 7) Saving Workspace Layouts
Version 24.12+
Configure the KITS layout as preferred, click the ‘Save current layout’, enter a workspace layout name, and click ‘OK’ to save the layout.


You can also configure the layout to use on startup via the pin next to the layout name in the drop down or select a different layout via the same drop down.

¶ 8) Viewing Basic Intersection Information
Right-click on an intersection from the Layer Manager or from the symbol on map and select ‘Information’ to view pertinent information related to the intersection. In addition to basic intersection definition information, this window will also display all recent events over the period specified (last 30 minutes, last hour, or last day).
¶ 9) Dashboard View
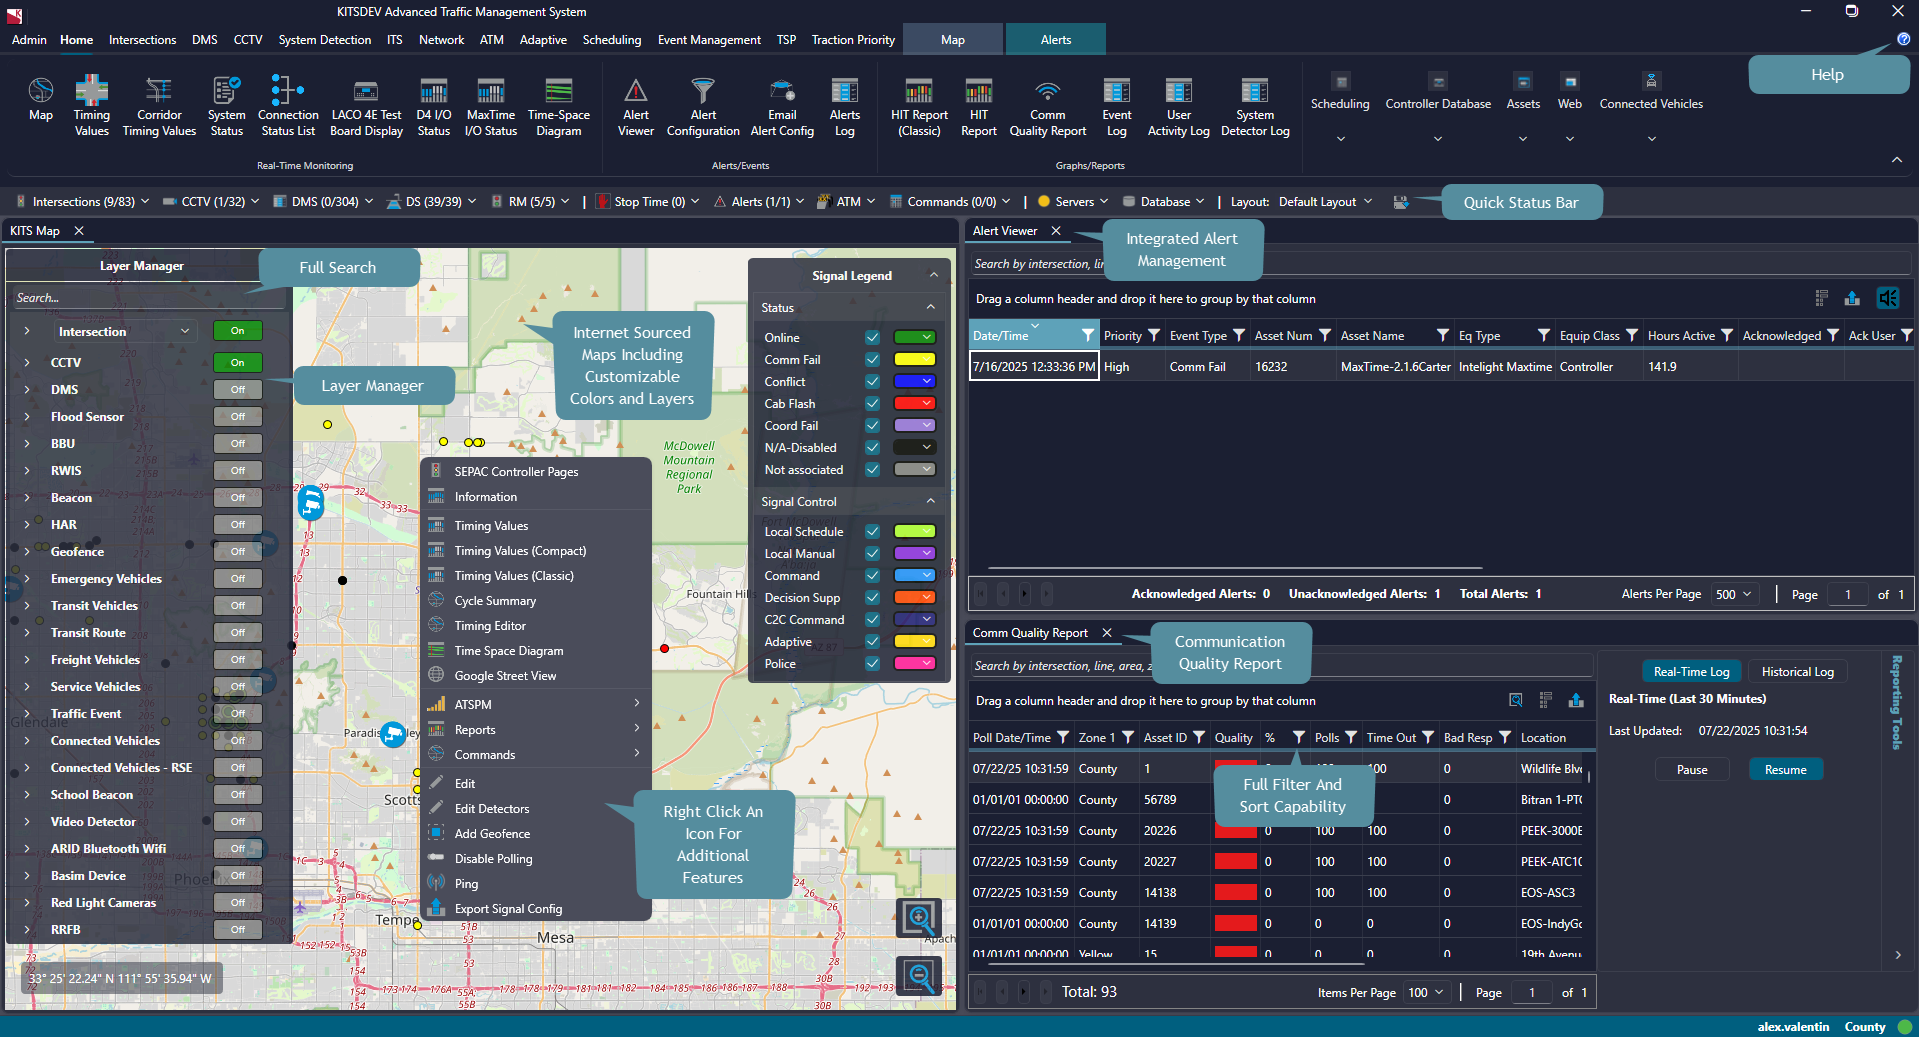
The main window layout within the dashboard view can be configured to show whatever the user wants to see. A sample setup is shown in the image below. To adjust where windows are docked, click on the window tab and drag to the desired docking location.
