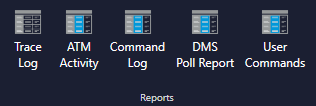
¶ ATM Trace Log (ATM | Reports)
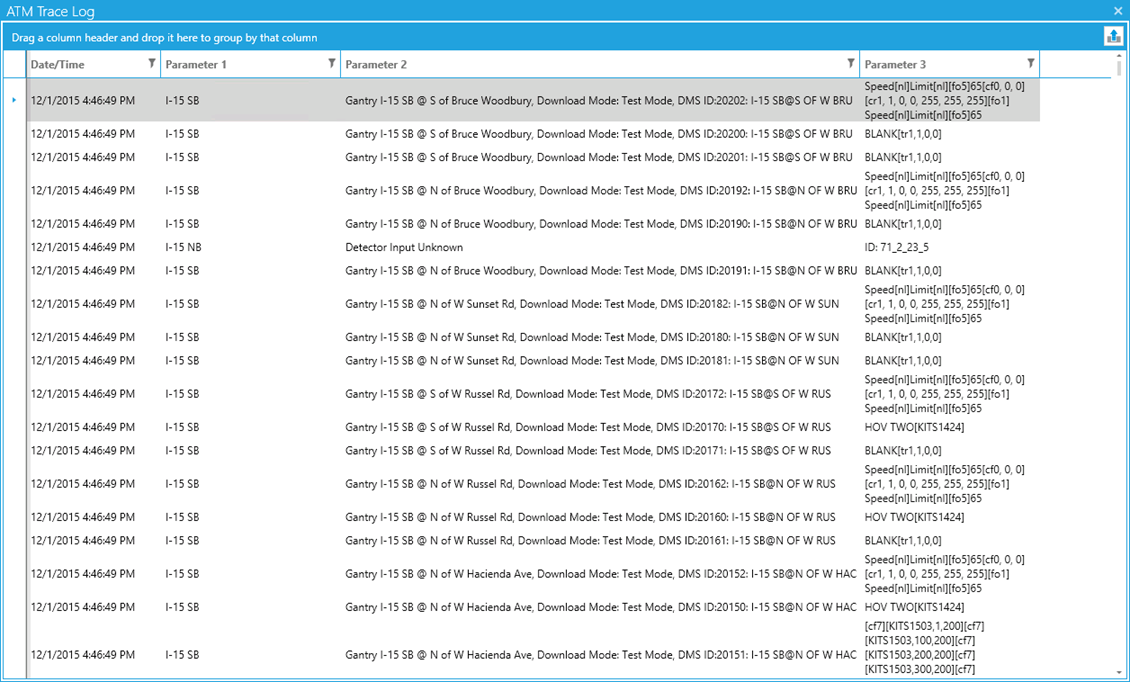
The ATM Trace log displays a trace of ATM entries that have been generated by the ATM and DMS services. Examples of entries are ATM processes starting, messages commanded to gantries, and much more.

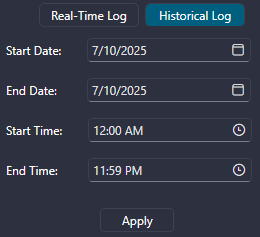
¶ ATM Trace Log Controls
If the toolbox is not already showing, select the "Toolbox" button to show the ATM Trace Log controls . From this toolbox, the user can pause, resume, and view historical data within the ATM Trace Log. This pane is shown by default, but clicking the pin icon will collapse it.
¶ Sorting
To sort the events by column, click on the desired column header. One click on the column header will sort the list in ascending order by that column and a second click will sort the list in descending order.

¶ Filtering
The ATM Trace Log has the ability to filter results. To filter by any column, click the icon to the right-hand side of the column header. This brings up a filter popup that allows the user to specify a variety of filtering options as shown below (image shown is for the Parameter 1 column):

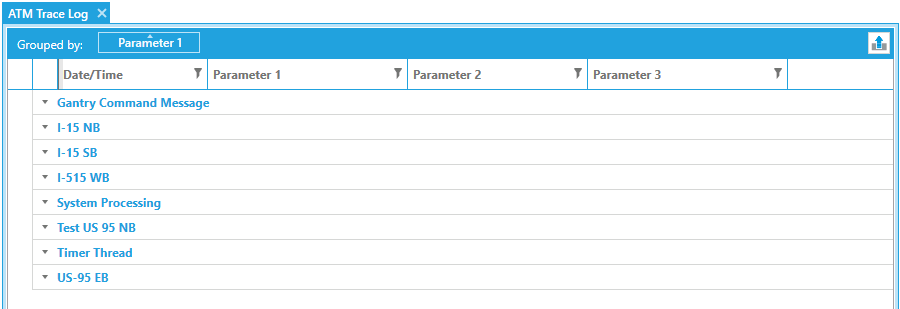
¶ Grouping
The user has the capability to organize entries into groups. To group by a column, click on the column header and drag it to the area at the top of the form with the text that reads "Drag a column header and drop it here to group by that column". This will break the list up into distinct sections for each value in the column that is being grouped by. To view the entries under a section, click the down arrow on the left-hand side of the section header. See the below image for an example of the list being grouped by the Parameter 1 column:
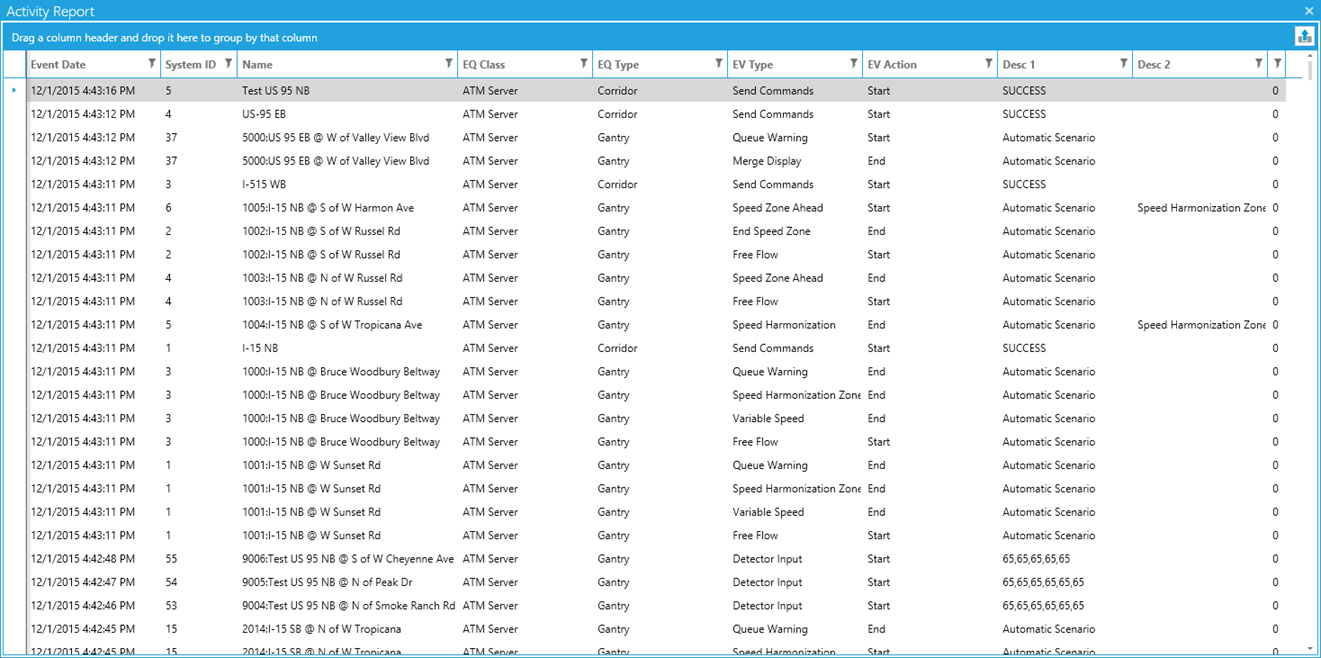
¶ ATM Activity (ATM | Reports)
The ATM Activity Report is used to view the corridor and gantry activity generated by the ATM Server for the system.

| Column | Description |
| Event Date | Date and time the event occurred |
| System ID | This is an ID for the asset. This ID is typically database-generated. |
| Name | Displays the name of the asset for which the entry is created (e.g. corridor name, gantry name, etc.) |
| EQ Class | The server that generate the entry |
| EQ Type | The type of asset the entry is for (e.g. corridor, gantry, etc.) |
| EV Type | This is the type of event that is being entered |
| EV Action | This is typically a start or end action for the entry |
| Desc 1 | Displays additional information for the entry |
| Desc 2 | Displays additional information for the entry |
¶ ATM Activity Report Controls
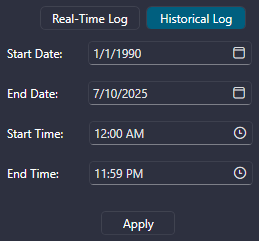
If the toolbox is not already showing, select the "Toolbox" button to show the ATM Activity Report controls . From this toolbox, the user can pause, resume, and view historical data within the ATM Activity Report. This pane is shown by default, but clicking the pin icon will collapse it.
¶ Sorting
To sort the events by column, click on the desired column header. One click on the column header will sort the list in ascending order by that column and a second click will sort the list in descending order.

¶ Filtering
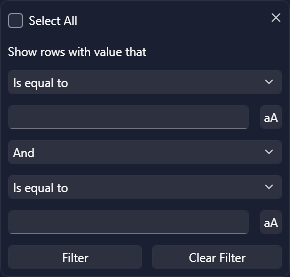
The ATM Activity Report has the ability to filter results. To filter by any column, click the icon to the right-hand side of the column header. This brings up a filter popup that allows the user to specify a variety of filtering options as shown below (image shown is for the Event Type column):
¶ Grouping
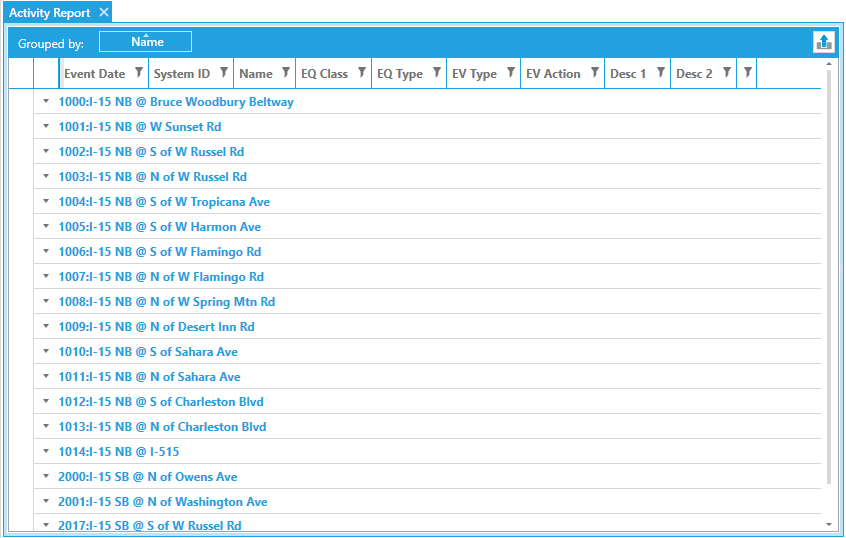
The user has the capability to organize entries into groups. To group by a column, click on the column header and drag it to the area at the top of the form with the text that reads "Drag a column header and drop it here to group by that column". This will break the list up into distinct sections for each value in the column that is being grouped by. To view the entries under a section, click the down arrow on the left-hand side of the section header. See the below image for an example of the list being grouped by the Name column:
¶ ATM Commands (ATM | Commands)
The ATM Commands report displays entries for automatic and manual scenarios that have been commanded by the ATM Server.
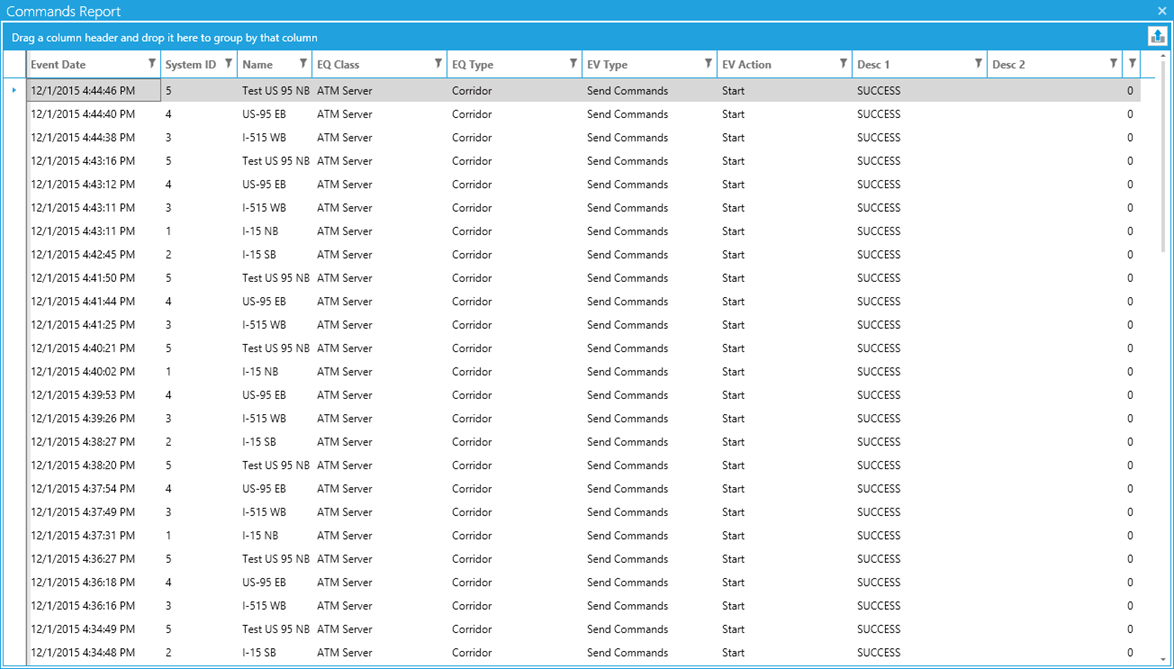

| Column | Description |
| Event Date | Date and time the event occurred |
| System ID | This is an ID for the asset. This ID is typically database-generated. |
| Name | Displays the name of the asset for which the entry is created (corridor name, gantry name, etc.) |
| EQ Class | The server that generate the entry |
| EQ Type | The type of asset the entry is for (corridor, gantry, etc.) |
| EV Type | This is the event of a command from the ATM Server |
| EV Action | This is typically a start or end action for the command |
| Desc 1 | Displays the SUCCESS or FAILED state of a command |
| Desc 2 | Displays additional information for the entry |
¶ ATM Commands Report Controls
If the toolbox is not already showing, select the "Toolbox" button to show the ATM Commands Report controls . From this toolbox, the user can pause, resume, and view historical data within the ATM Commands Report. This pane is shown by default, but clicking the pin icon will collapse it.

¶ Sorting
To sort the events by column, click on the desired column header. One click on the column header will sort the list in ascending order by that column and a second click will sort the list in descending order.
¶ Filtering
The ATM Commands Report has the ability to filter results. To filter by any column, click the icon to the right-hand side of the column header. This brings up a filter popup that allows the user to specify a variety of filtering options as shown below (image shown is for the Event Type column):
¶ Grouping
The user has the capability to organize entries into groups. To group by a column, click on the column header and drag it to the area at the top of the form with the text that reads "Drag a column header and drop it here to group by that column". This will break the list up into distinct sections for each value in the column that is being grouped by. To view the entries under a section, click the down arrow on the left-hand side of the section header. See the below image for an example of the list being grouped by the Name column:
¶ User Activity Log (Intersections | History Reports | User Activity Log)
The User Activity Log displays all actions that users have performed within KITS such as saving data, downloading controller parameters, logging on to KITS, and a variety of other actions.
.png)

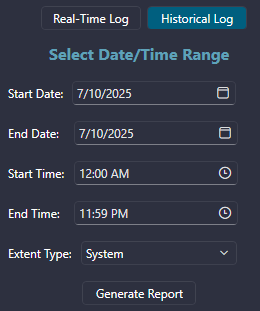
When the User Activity Log is launched, the display defaults to show the last 30 minutes of real-time data. To adjust the date/time range of the data being displayed, refer to Report Controls.
¶ Parameter Descriptions
The parameters available for this report are as follows:
| Field | Description |
| Date/Time | Displays the date and time that the user action was logged |
| User ID | Displays the Windows login of the user that performed the corresponding action |
| Unit | Displays the unit of functionality within KITS where the action occurred |
| Action | Displays the action that was performed (i.e. Save, Log On, Upload, etc.) |
| Form | Displays the form where the corresponding action was performed |
| Description 1 | Displays additional information for certain actions |
| Description 2 | Displays additional information for certain actions |