¶ Action Log (Adaptive | Action Log)
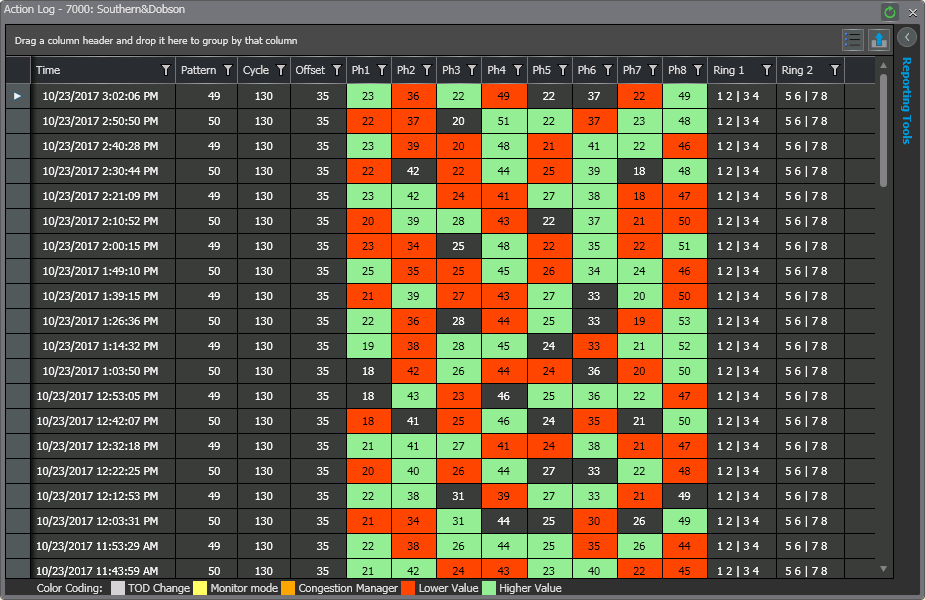
The Adaptive Action Log will display the commands taken by the adaptive system in a grid display. The asset number and name of the associated intersection is shown in the tab title.
The color coding on each cell indicates an adjustment in time, red if a decrease occurred and green if an increase occurred. If no color is displayed, then KADENCE did not make an adjustment at that sample time. The Time and Pattern columns may also contain color coding. A legend containing these colors and descriptions are found at the bottom of the form.

¶ Filtering Functionality
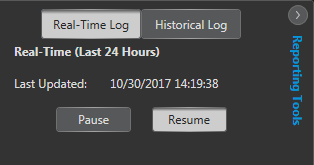
A user may change the range of dates shown by using Reporting Tools. The Reporting Tools section is located at the top right of the window and can be expanded or hidden using the arrow icon. By default, the chart shows real-time information, but the start and end dates can be customized using the Historical Log settings. The Real-Time Log may also be paused, so that it displays the most recent 24 hours of information at the time the pause button was clicked, but does not update with newer data.

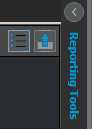
A user may customize visible columns using the column selection feature, shown as a bullet list. Additionally, a user may export this data to Excel using the button whose image contains a vertical arrow.
¶ Phase Util (Adaptive | Phase Util)
The Phase Utilization graphic will display pattern, cycle lengths, offsets, and splits, as well as the corresponding phase utilizations for each full cycle.
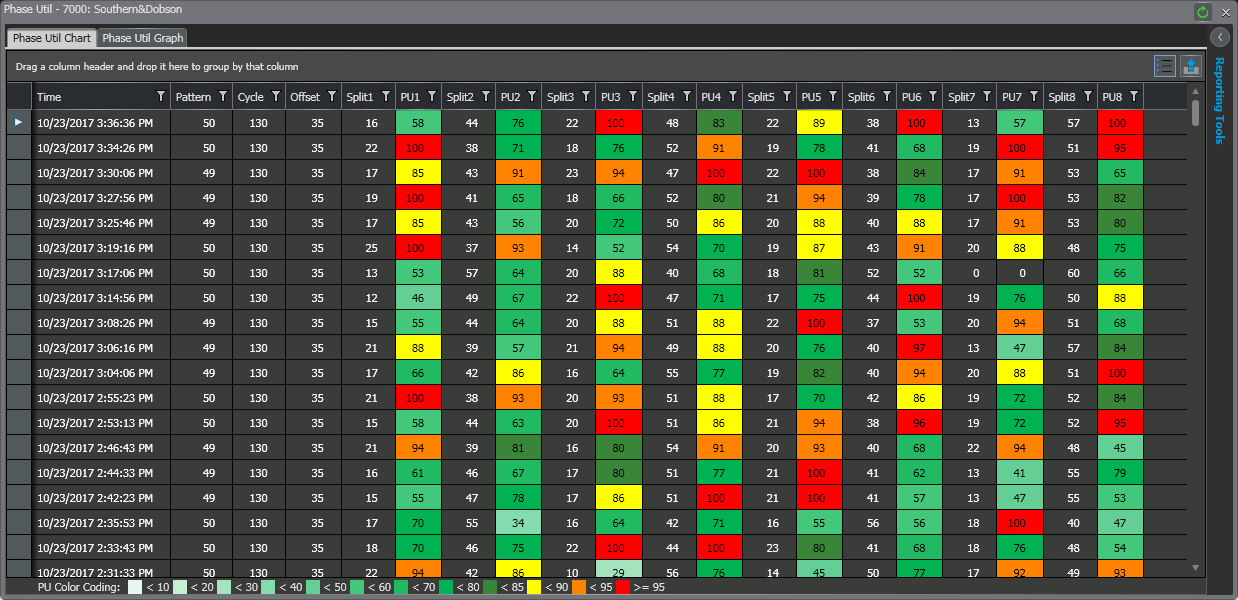
¶ Split Utilization Chart
The Phase Utilization Chart shows the phase utilization for each split in a list view. The color codes highlight unsaturated and oversaturated conditions. A legend of these colors is shown at the bottom left of the window. For phases that have split adjustment enabled, Kadence will adjust values by “stealing” time from unsaturated phases and giving them to oversaturated phases.

¶ Filtering Functionality
A user may change the range of dates shown in the chart by using Reporting Tools. The Reporting Tools section is located at the top right of the window and can be expanded or hidden using the arrow icon. By default, the chart shows real-time information, but the start and end dates can be customized using the Historical Log settings. The Real-Time Log may also be paused, so that it displays the most recent 24 hours of information at the time the pause button was clicked, but does not update with newer data.
.png)
A user may customize visible columns using the column selection feature, shown as a bullet list. Additionally, a user may export this data to Excel using the button whose image contains a vertical arrow.
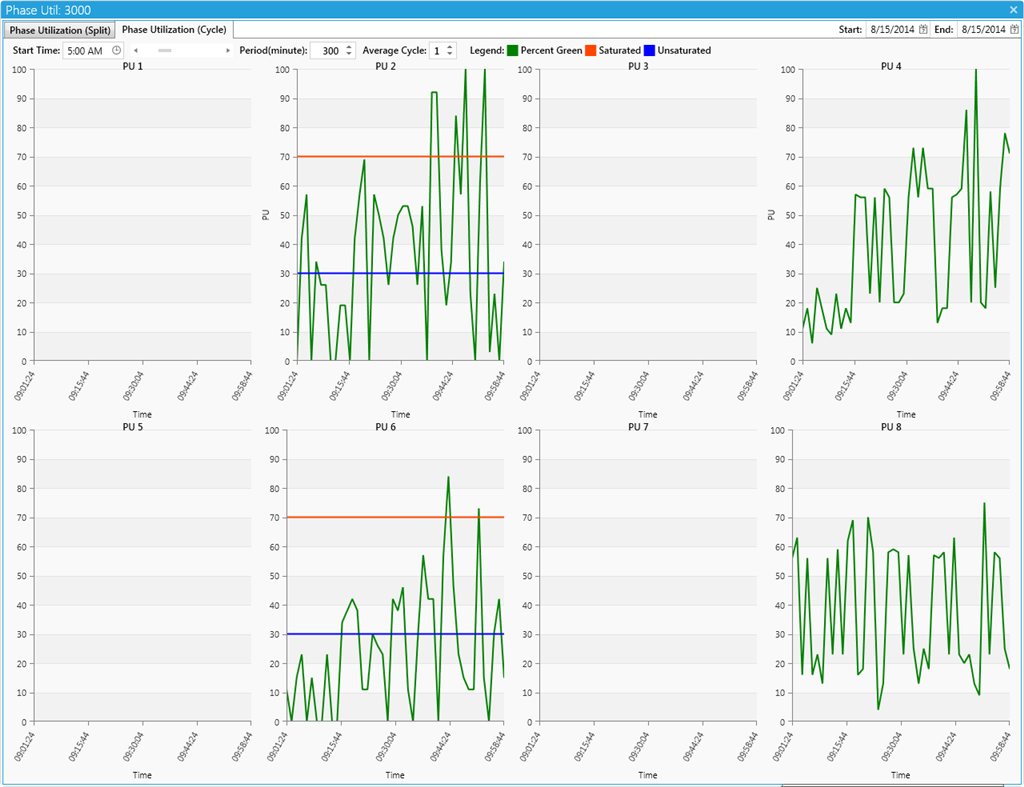
¶ Phase Utilization Graph
In the graphical display you see that the Percent Green is graphed over time. The user-configurable Saturation thresholds are displayed on the coordinated phase. If Kadence detects a Saturation or Unsaturation condition on the phases, it will attempt to increase or decrease the cycle respectively.

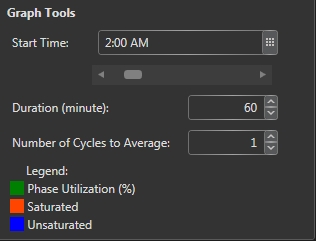
¶ Graph Filtering Functionality
Similar to the Chart functionality, there is a Date Range filter in the Reporting Tools at the top right of the page. Graph Tools are available at the bottom of the Reporting Tools section, allowing a user to adjust the start time by typing a value in, using the dropdown, or using the slider near the dropdown. In addition to Date and Time filters, there is a Duration setting and Average Cycle adjustment as well as a Legend available to the user.

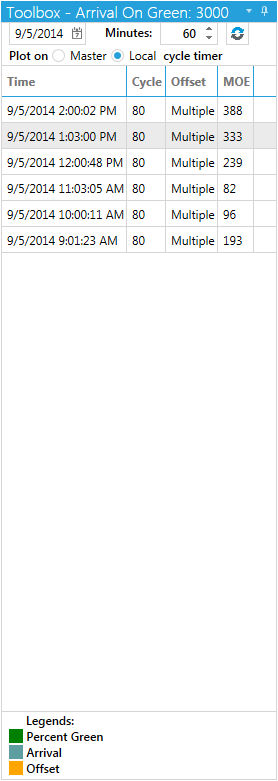
¶ Arrival On Green (Adaptive | Arrival On Green)
The Arrival on Green graph shows the vehicle occupancy and green time for each phase (inbound and outbound) averaged over the specified number of cycles. The Percent Green portion of the graph shows the percentage of time that the given phase was green averaged over the specified number of cycles. The Arrival portion of the graph shows the vehicle occupancy for each second, averaged over the specified number of cycles. Finally, the Offset line(s) shows the offset for that cycle or, if viewing an average over multiple cycles, each of the different offsets that occurred over each of the cycles. The green portion of the graph represents the green time over the given time segment. The yellow vertical lines display the offset and the blue lines show detector data. This color legend is also shown at the bottom of the Arrival On Green Toolbox.
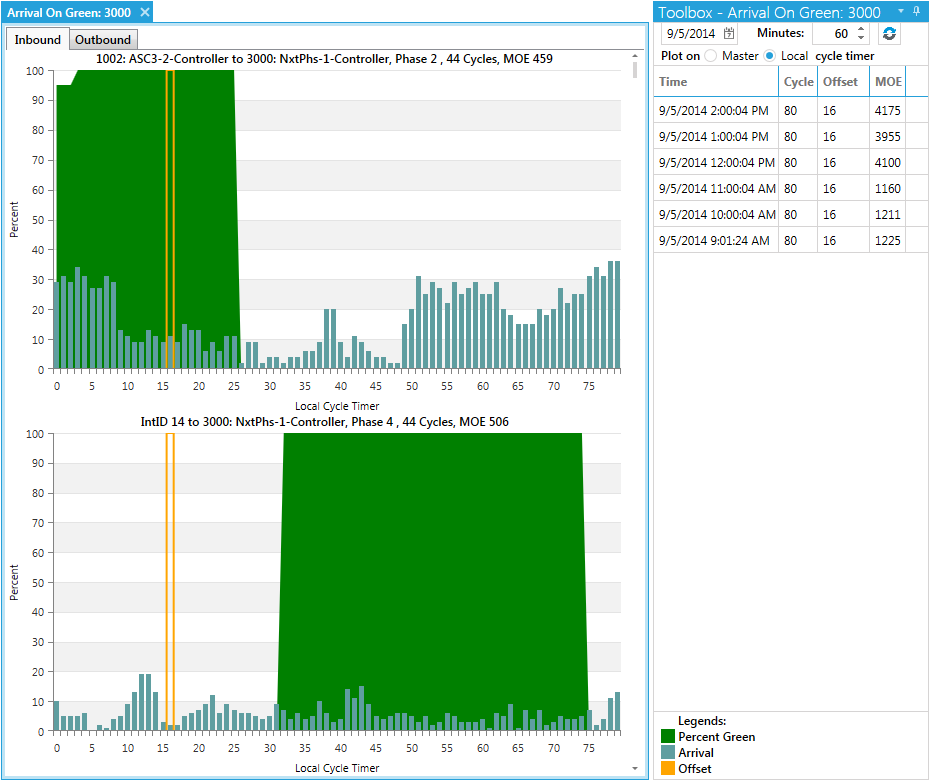

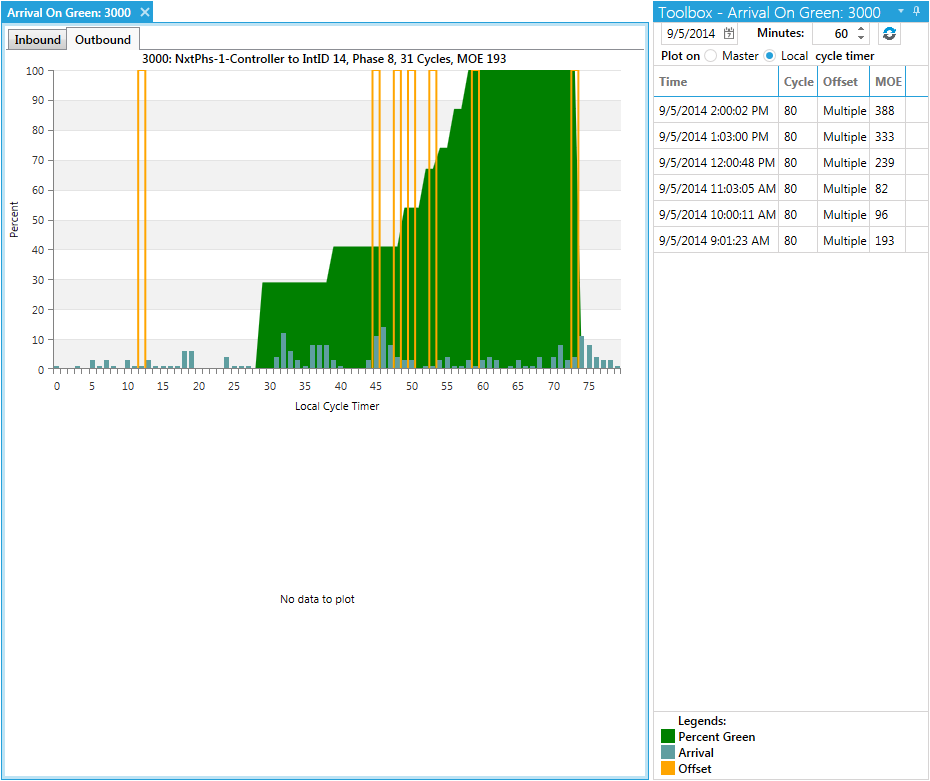
¶ Arrival On Green Toolbox
The right sidebar contains the tools needed for filtering and selecting aspects of the Arrival On Green page.