¶ Communication Quality Report
The Communication Quality Report displays Communication Quality information for all KITS intersections in a tabular format. This information is useful for understanding basic second-by-second communication information for a given intersection.
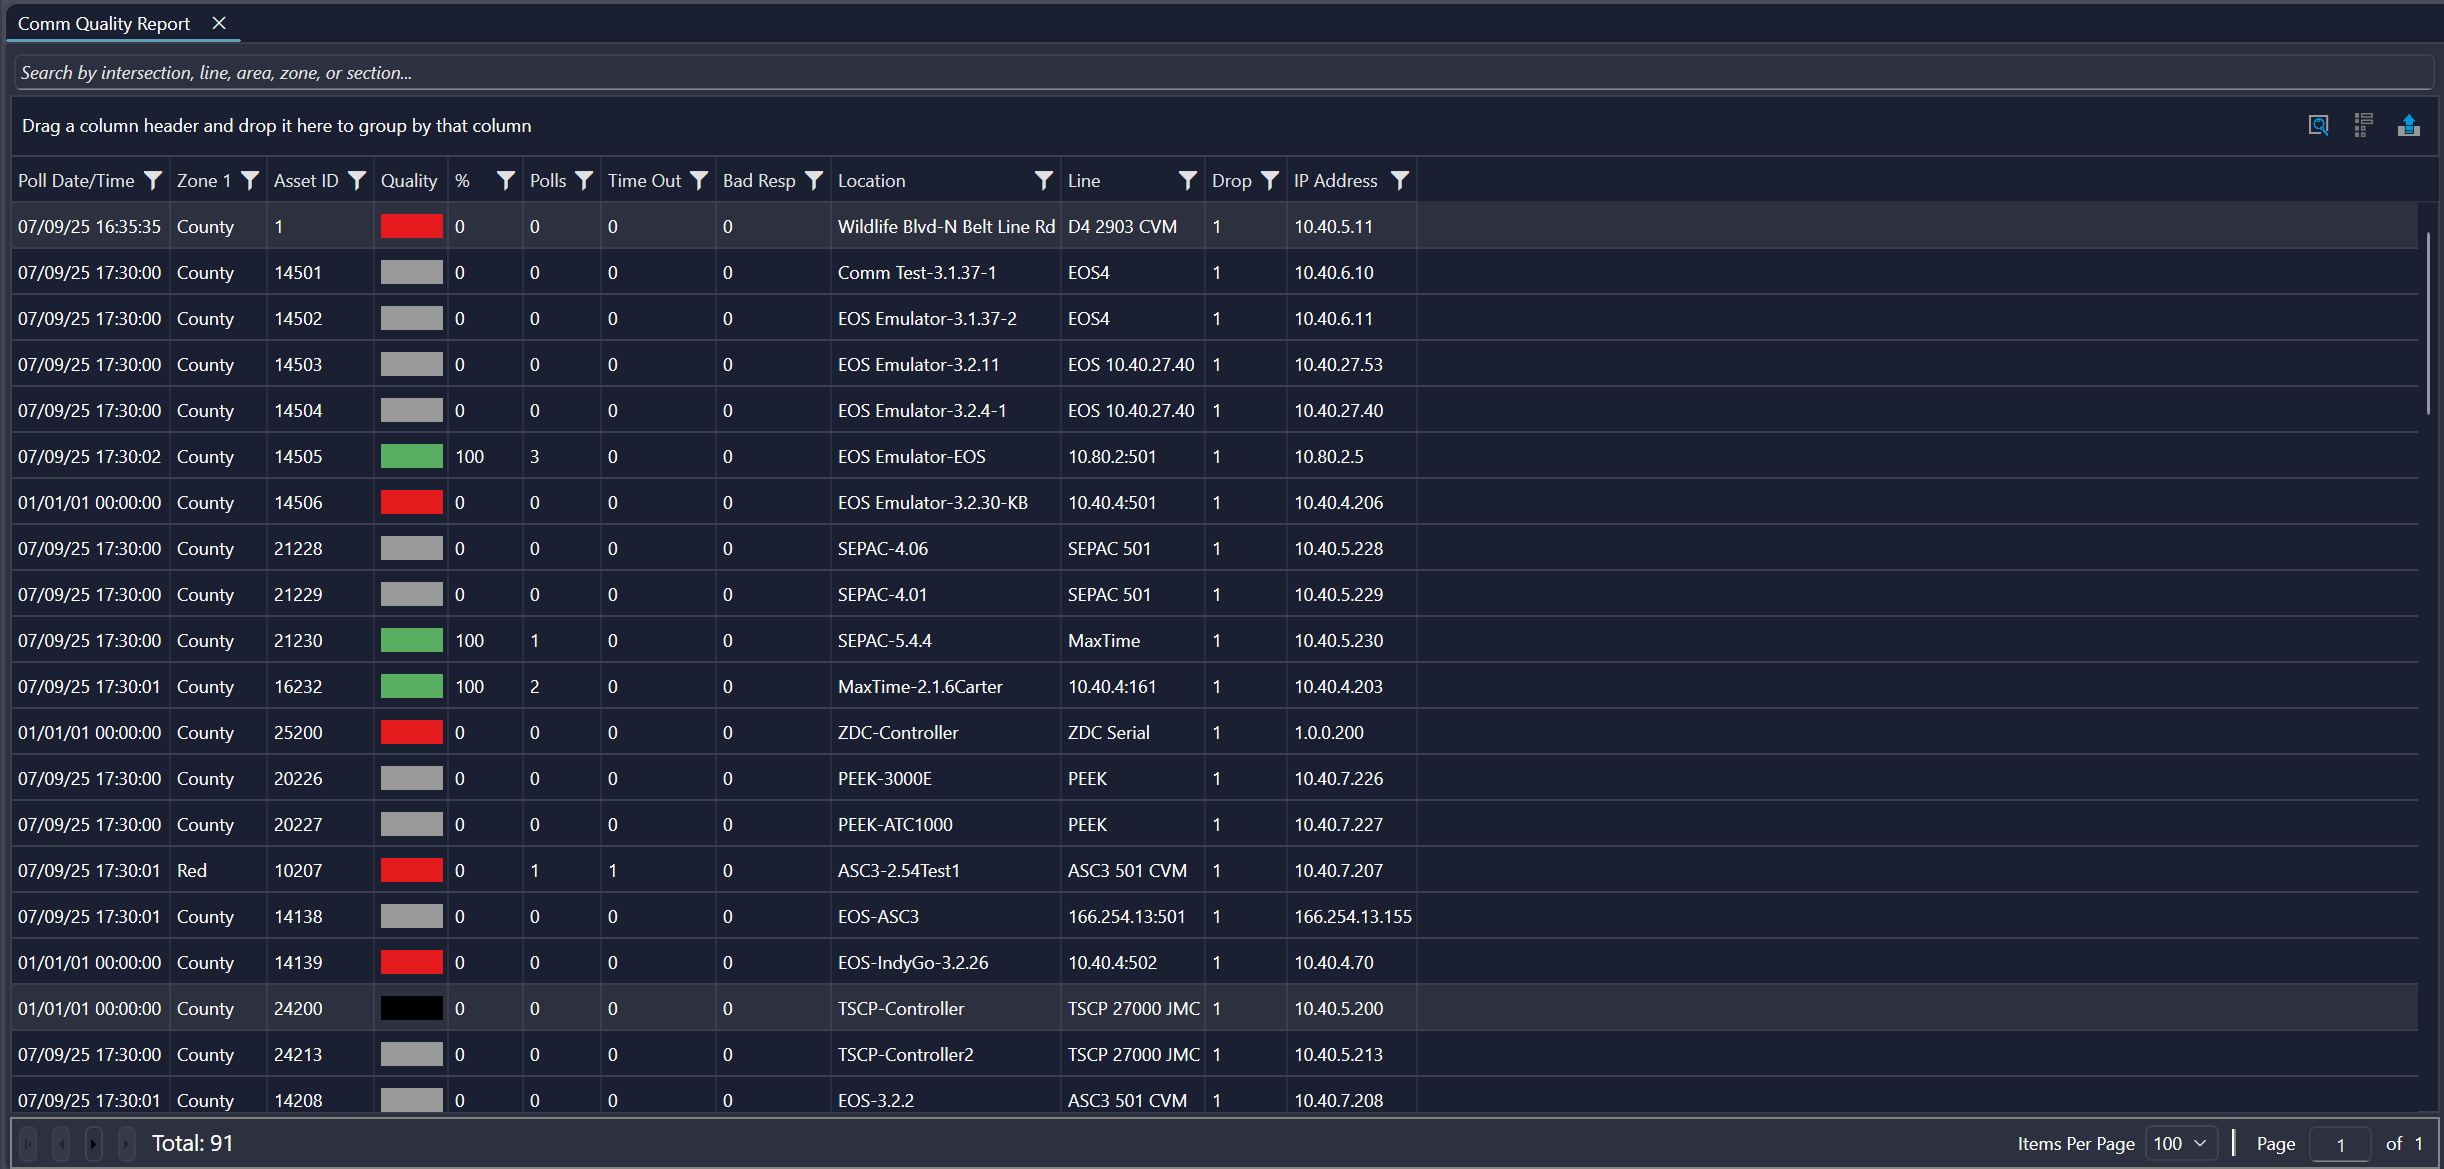

When the Communication Quality Report is launched, the display defaults to show the last 30 minutes of real-time data. To adjust the date/time range of the data being displayed, refer to Report Controls.
¶ Parameter Descriptions
The parameters available for this report are as follows:
| Field | Description |
| Zone1 | Displays the primary zone that the intersection belongs to |
| Asset ID | Displays the intersection Asset ID |
| Quality | Shows a color representation of the Communication Quality (i.e. red = 0%, green = 95%-100%) |
| % | Displays the percentage of poll messages that received good responses |
| Polls | Displays the number of polls during the current 15 minute period |
| Time Out | Displays the number of polls that timed out over the current 15 minute period |
| Bad Resp | Displays the number of polls that received bad responses over the current 15 minute period |
| Location | Displays the intersection name |
| Line | Displays the Line to which the intersection belongs |
| Drop | Displays the intersection drop address |
| IP Address | Displays the intersection's IP address |
| Circuit ID | Displays the circuit ID that corresponds to the Line that the intersection belongs to |
| Segment No. | Displays the KITS segment to which the intersection belongs |