¶ Alert Viewer
The KITS Alert Viewer displays all active alerts in the ATMS. Alerts are shown specific to each user are filtered down based on the Event Filter configuration for that user.
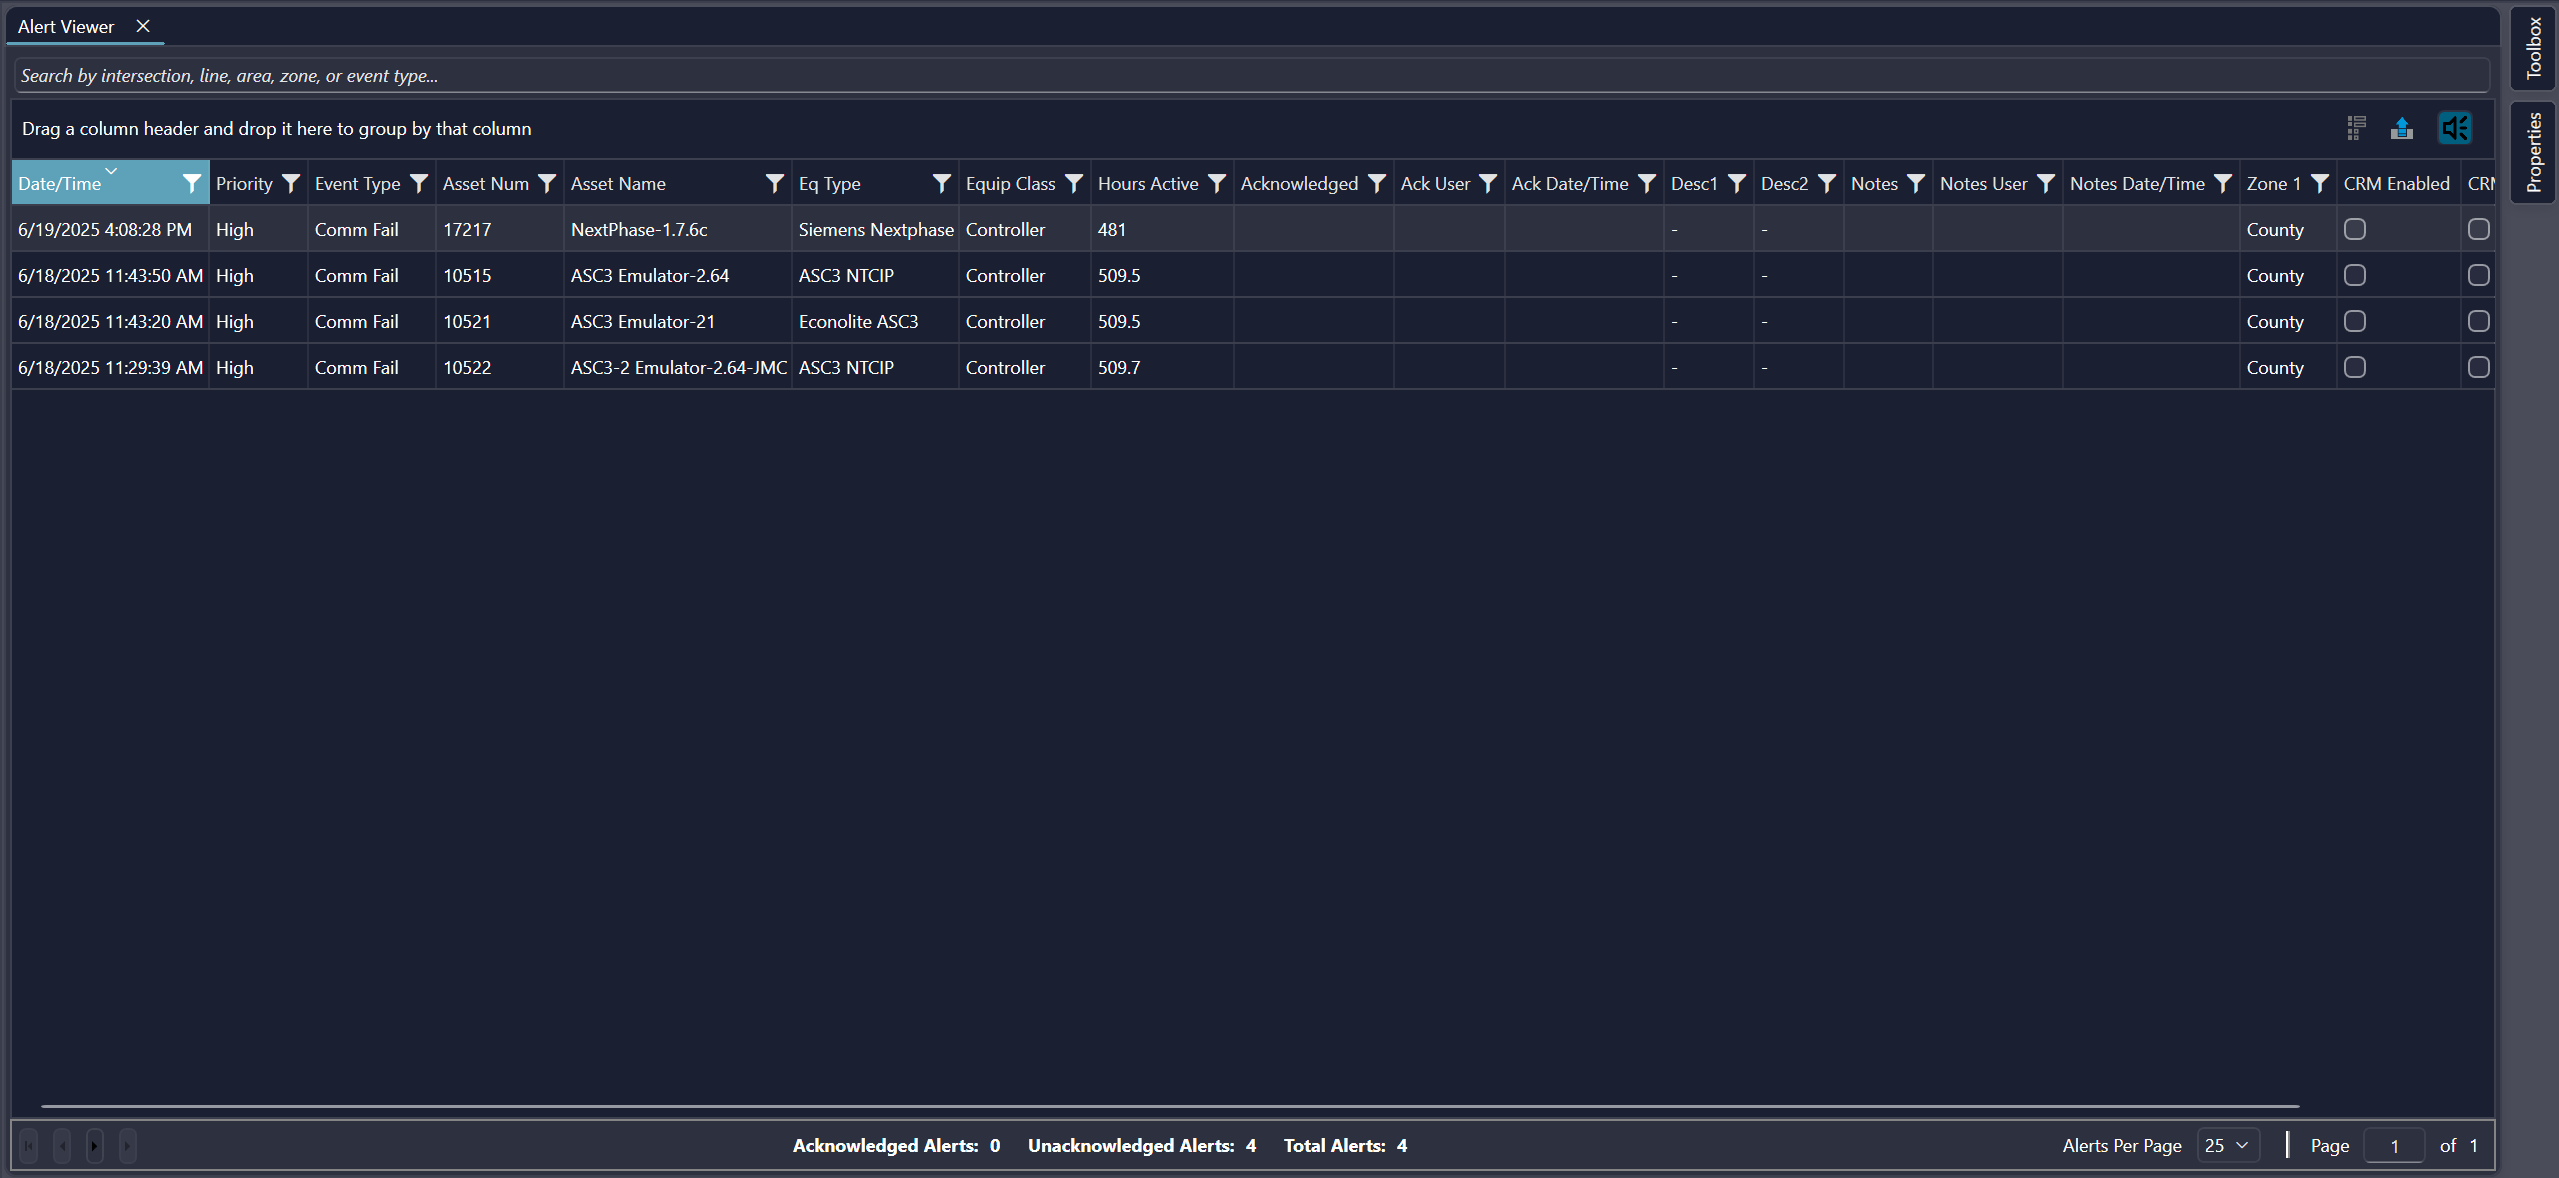
¶ Overview
The KITS Alert Viewer gives the user a variety of tools to view and manage alerts. By default, the Alert Viewer displays 25 alerts per page but this value can be adjusted by clicking the "Alerts Per Page" dropdown and selecting the desired value. Additionally, the number of Acknowledged Alerts, Unacknowledged Alerts, and Total Alerts is displayed along the bottom of the Alert Viewer.

¶ Alert Viewer Controls
After opening the Alert Viewer, an 'Alerts' tab will appear on the KITS ribbon. This tab contains all of the Alert Viewer controls and display options.
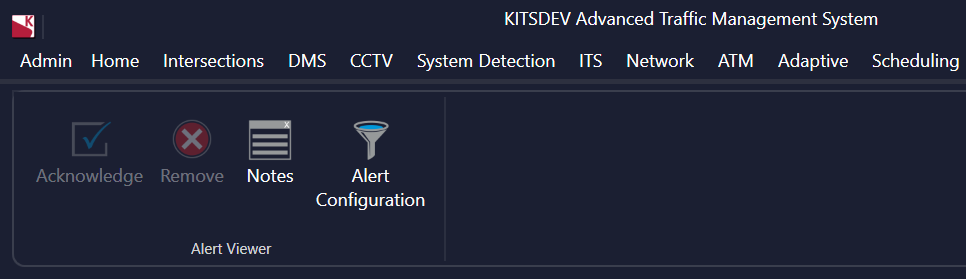
| Buttons | Description |
| Acknowledge | Acknowledges the selected alert(s). This adds acknowledged user and Date/Time to the alert(s). |
| Remove | Removes the selected alerts(s) |
| Notes | Allows note to be added to alert by user |
| Master Alert Configuration | Allows Master Role to configure which types of events are alertable |
| Event Filter | Opens the KITS Event Filter |
¶ Search Field
The Search Field gives the user the ability to search by Intersection, Line, Area, Zone, and Event Type. The Alert Viewer Search Field defaults to only show alerts that are active for the zone that the user is assigned to. To search by additional criteria, simply start typing into the Search Field and it will display all possible matches as the user types. Once one set of search criteria has been entered, the user can continue to type in the field to add more criteria to the search (e.g. search for a specific intersection and then add additional search criteria to search for an event type under that intersection).

¶ Select Columns
The Select Columns button allows the user to add or remove Alert Viewer columns.

The fields available are:
| Column | Description |
| Date/Time | Shows the date and time that the alert started |
| Priority | Displays whether the alert type is high, medium, or low priority as defined in the Event Filter |
| Event ID | Is the ID that uniquely identifies the alert type |
| Event Type | Displays the type of alert (e.g. comm fail, cab flash, plan command, etc.) |
| Sys ID | This is an ID for the intersection controller or other equipment. This ID is typically database-generated. |
| Asset Num | This is an operator-created ID for the intersection or other equipment. |
| Asset Name | Displays the name of the entity for which the alert is active (e.g. intersection name, line name, etc.) |
| Eq Type | Displays the type of controller (or other equip class entry), such as 'NextPhase' or a Bitran ID |
| Equip Class | Displays the source of the alert (e.g. controller, scheduler, RLCS controller, etc.) |
| Hours Active | Displays the number of hours that the alert has been active |
| Acknowledged | Indicates whether the alert has been acknowledged or not and from which source (KITS, Traction mobile app, etc.) |
| Ack User | Indicates the user that acknowledged the alert |
| Ack Date/Time | Shows the date and time that the alert was acknowledged |
| Desc1 | Displays additional information for the alert |
| Desc2 | Displays additional information for the alert |
| Notes | Shows notes added to alert |
| Notes User | Shows user that added notes |
| Notes Date/Time | Shows the date and time that the note was added |
| Zone 1 | Primary zone in which alert occurred |
| CRM Enabled | |
| CRM Sent | |
| CRM User | |
| Alarm ID | Is the unique number assigned to each alert |
| Agency ID | Is the KITS ID of the agency which the alert belongs to |
¶ Sorting
To sort the alerts by column, click on the desired column header. One click on the column header will sort the list in ascending order by that column and a second click will sort the list in descending order.
¶ Filtering
The Alert Viewer has 2 options for filtering the list of alerts:
- Using the Search field as described above.
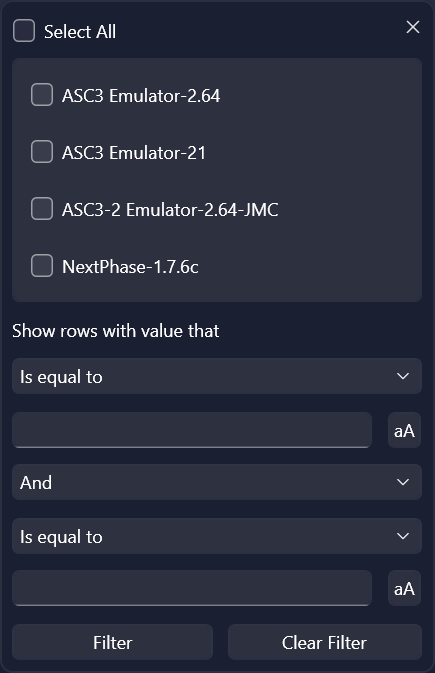
- To filter by any column, click the icon to the right-hand side of the column header. This brings up a filter popup that allows the user to specify a variety of filtering options as shown below (image shown is for the Event Type column):
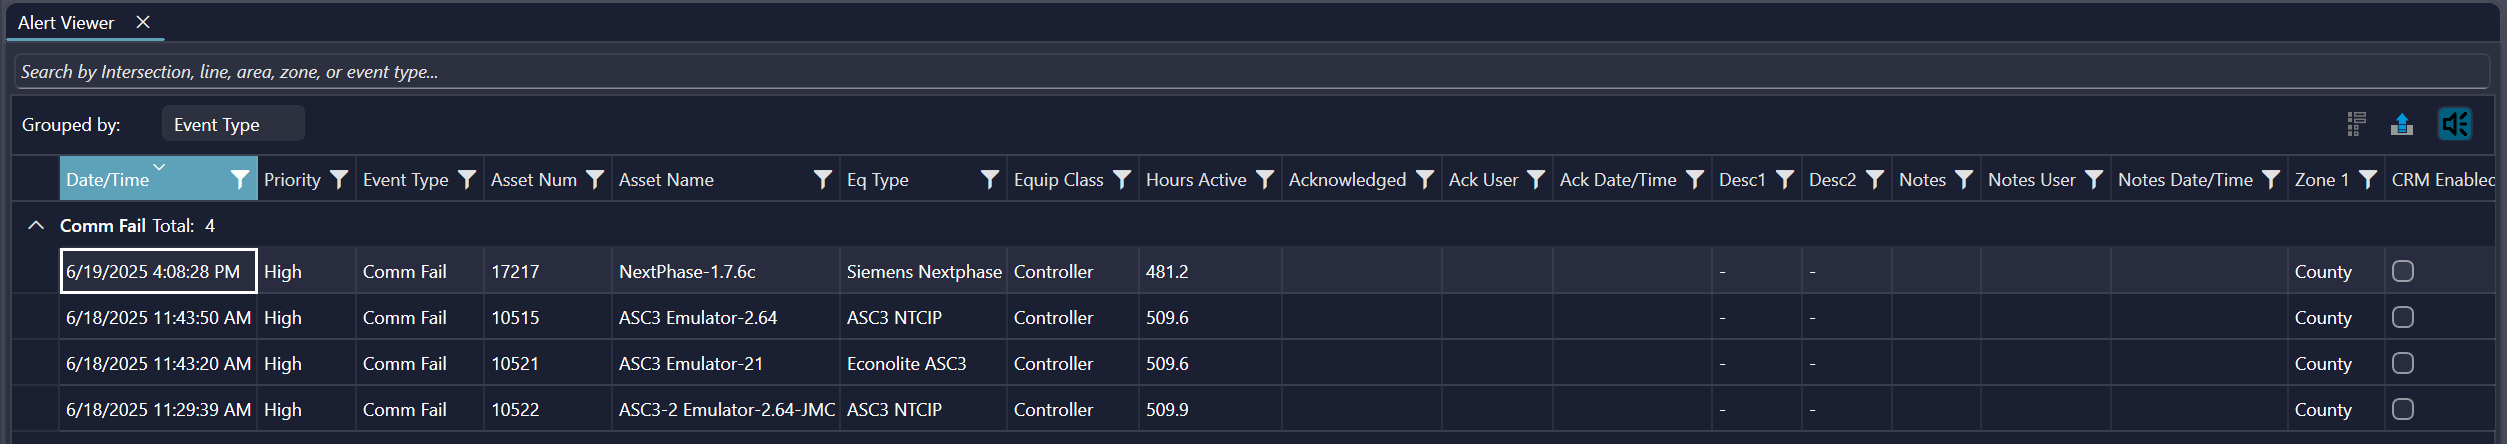
¶ Grouping
The user has the capability to organize alerts into groups. To group by a column, click on the column header and drag it to the area at the top of the form with the text that reads "Drag a column header and drop it here to group by that column". This will break the list up into distinct sections for each value in the column that is being grouped by. To view the entries under a section, click the down arrow on the left-hand side of the section header. See the below image for an example of the list being grouped by the Event Type column: