¶ Graphs/Reports
There are many graphs and reporting options within KITS to view data and diagnose issues within a system. The most popular graphs/reports are added to the Home Tab for ease of use:
¶ Standard Report Controls
The majority of reports available within KITS use a common set of controls for manipulating, filtering, and exporting the report data.
¶ Full Text Search
The icon highlighted below with the magnifying glass provides the ability to search the report results for a key phrase in any column. Only entries matching the key phrase will be shown, and the cell or cells with a match will be highlighted. Within each matching cell, the text which matches will be shown in colored font.
Numbers, such as Asset ID, match only on exact matches - the search term '900' will not include a result for an asset ID of '9000'. Date or time fields will not match any search term.

¶ Column Selection
Each report generates with a predetermined number of columns that display data appropriate to the report type. To customize which columns are displayed, users can click the Column Selection button and check/uncheck the desired column boxes. As columns are selected or de-selected, the report view will update in real-time to display the appropriate data.The Column Selection button is highlighted in red in the image below.


¶ Export
The icon highlighted below with the upward arrow provides the ability to export the report contents into an Excel, CSV, HTML, or PDF formats. To export the displayed results, simply select the export button, choose the appropriate file type, enter the name and location of the file and click Save.


¶ Extent and Date/Time Selection
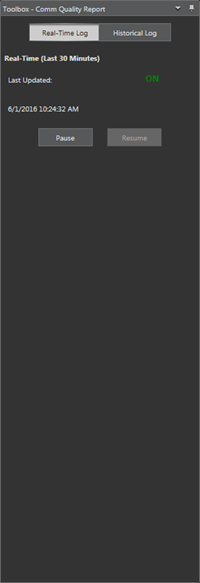
When a report is first launched, the display defaults to showing the last 30 minutes of real-time data, with new events automatically populating the report as they come in. Further information pertaining to the real-time status is shown in the toolbox display that also appears when the report is launched. From this display, users can pause or resume the real-time updates, or they can click the Historical Log button to show advanced extent and date/time filtering for historical results.

When viewing historical results for the selected report, the user must enter valid start and end dates, as well as valid start and end times for the results they would like to see. It is important to note that the time range that is selected is applied independently on each day covered by the date range. So if the start date is set to 6-1-2014 and the end date is set to 6-6-2014, then a start time of 6:00 AM and an end time of 11:00 AM would result in a report that only shows entries between 6:00 AM and 11:00 AM on each of those days.
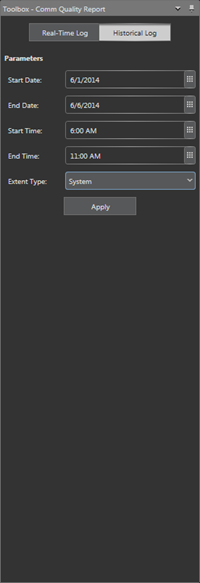

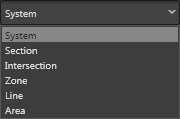
Once the date and time range has been specified, the user may hit Apply to generate the report results for the entire system ('System' extent) or they have the option of specifying a different extent to generate results for a specific asset or grouping. If an Extent Type other than 'System' is specified, then an appropriate selection dialog will appear when the user hits Apply and they may select the specific extent they would like to view results for. The different Extent Types typically available for a report are shown below.

¶ Filtering, Grouping, Sorting and Searching
Each of the KITS reports has a variety of filtering, grouping, sorting and searching functions built in to the report controls.
To search for results under a specific asset or grouping, simply click on the search field, enter the appropriate search criteria, and the report will update to only show results for the appropriate asset or grouping. The default text that shows in the search field before you click on it indicates what search terms are supported (e.g. in many cases the supported search criteria is Intersection, Section, Line, Area, or Zone).


In addition to the standard search options, full text search is available for all reports that allows users to search text in all of the report columns. To open the full text search bar, click the search icon or press CTRL + F. Then, start typing into the full text search field that appears below the standard search field.


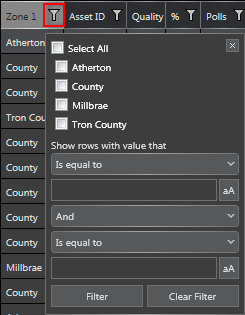
To filter down the displayed results, click the filter icon on the relevant column to bring up the filter dialog. From here, you can specify which results you do or do not want displayed on the report. For columns with numerical values, there are advanced filtering functions available such as only displaying results that are greater than or less than a certain value in addition to And and Or conditions.
To sort results, simply click the column you want to sort by. A single click sorts by ascending order, a second click sorts by descending order, and a third click clears the sorting and puts the results back in the default ordering.
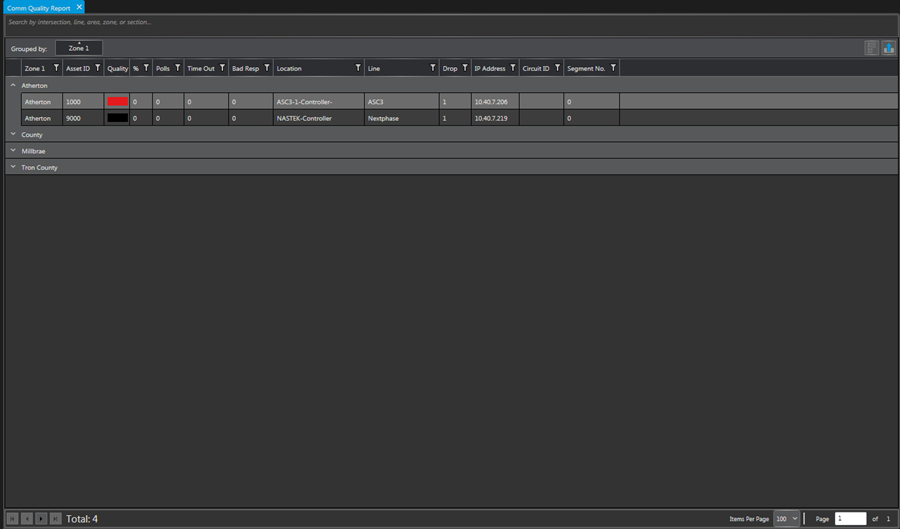
To group results, click and drag the desired column into the area above the grid that says "Drag a column header and drop it here to group by that column". Once a column has been dragged into this location, the report will update to separate all entries with the same values in that column into appropriate groups. To see the contents under any of the groups, simply click the group name and it will expand to show all data relevant to that group. Below is an example of the Communication Quality Report that is grouped by the Zone1 column.