¶ Overview
Use the Time-Space Diagram to view the green band for a given arterial by plan or time of day. An arterial can be defined in the Arterial Definition form. When defining an arterial, each intersection must define an upstream and downstream phase. A green band will be drawn attempting to connect the upstream and downstream phases using the distance and default speed for each link between the intersections. As the speed increases on a link, the slope of the green band decreases. Any intersections running free will show as a grey line in the time-space diagram. The green band will be shown as if the free intersection’s through phases are constantly being serviced.

¶ Scratch Timing Versions with the Time-Space Diagram
The option for timing version notes whether the time-space diagram will use Current, Future or Scratch timing. Selecting scratch database timing will automatically set the Plan Time Source to database. If some intersections within the selected corridor do not have scratch timing, the user will be prompted by the software to allow scratch timing for those intersections to automatically be generated, using the current timing.
¶ Viewing a Time-Space Diagram
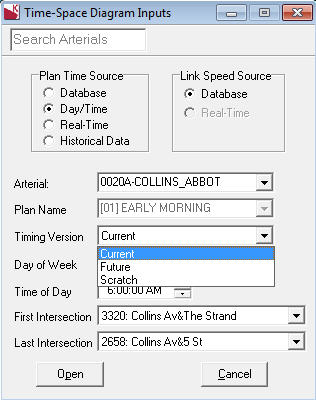
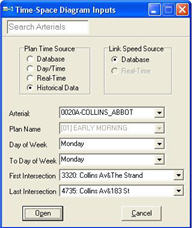
To view a time-space diagram, select the Time-Space Diagram menu option. KITS will display the Time-Space Diagram Inputs form prompting the user to select a pre-defined arterial, the type of time-space diagram to be displayed, and the first and last intersection within the arterial that the user would like displayed on the Time-Space Diagram.
| Data Element | Description |
| Plan Time Source |
Used to select the type of TSD to be displayed: Database – select a timing plan from the database using the plan name drop-down Day/Time – select a day of week and time of day to display a TSD. If any intersections do not have the same timing plan running as the first intersection in the arterial, the process will abort Historical – show the actual values of the green times for a given time of day or date for up to 30 days in the past. This option uses the HIT data to display the actual performance and green bands on an arterial |
| Link Speed Source | Used to select the source of link speed shown on the display. If "Real-Time" is chosen as the Link Speed source and any links are defined for this arterial, the speed detected by the detector station is substituted for the configured link speed value in the database. |
| Arterial | Name of the selected arterial |
| Plan Name | Name of the plan to be shown on the TSD when selecting “Database” in the Plan Time Source selection |
| Day of Week | Day of the week to show data for, when selecting “Day/Time” option in the Plan Time Source selection |
| Time of Day | Time of day to show data for, when selecting “Day/Time” option in the Plan Time Source selection |
| Date | Date to show data for, when selecting "Historical Data" option in the Plan Time Source selection |
| First Intersection | Used to select the starting intersection to be displayed on the TSD. Defaults to the first intersection on the arterial. Cannot be set to an intersection downstream of the last intersection. |
| Last Intersection | Used to select the ending intersection to be displayed on the TSD. Defaults to the last intersection on the arterial. Cannot be set to an intersection upstream of the first intersection. |
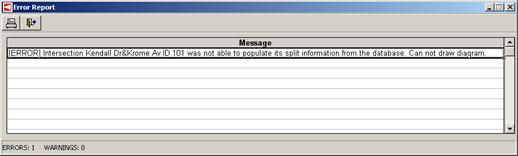
When selecting “Database” on the plan source selection, if any intersections in the arterial do not have any cycle, split and offset data in the coordination all plans page for that plan number, a notice will be displayed as shown below and the operation is aborted.
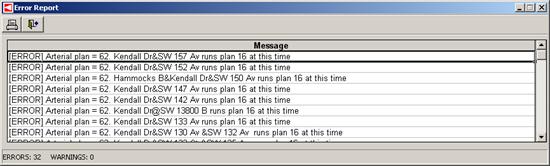
When selecting “Day/Time” on the plan source selection, if any intersections in the arterial are running a different timing plan than the first intersection in the arterial, a notice will be displayed as shown below and the operation is aborted.

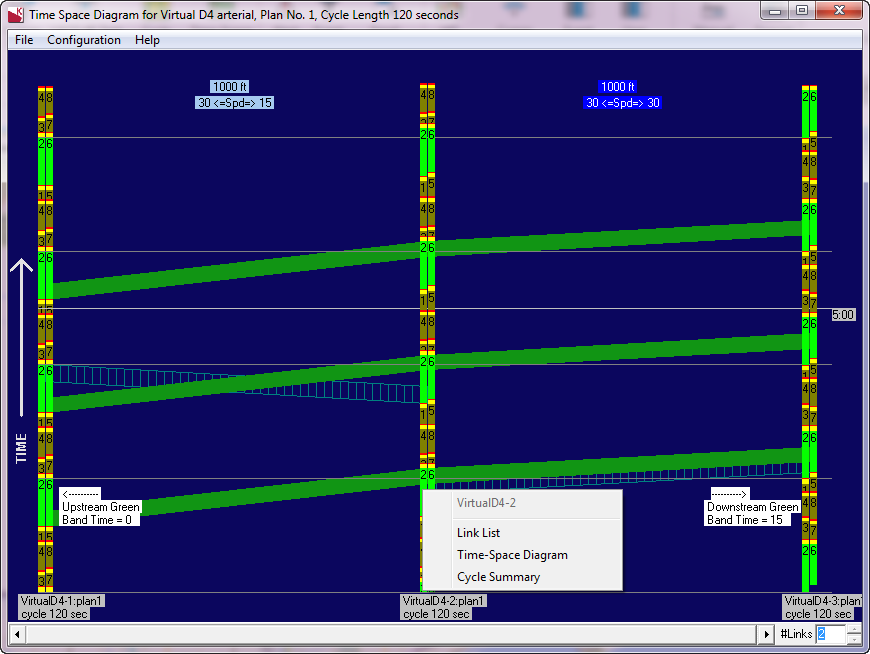
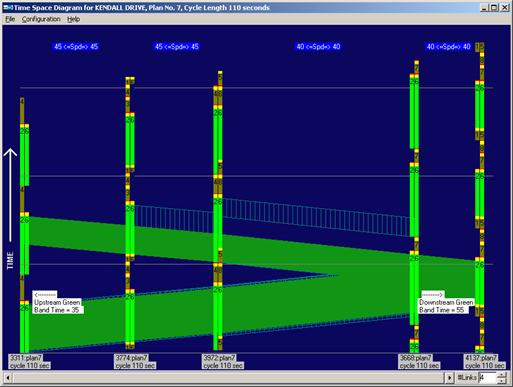
Once the inputs are selected, the Time-Space Diagram will display the resultant green band. The header of the Time Space diagram will display certain selection dialog criteria - in the image below, the header displays the arterial name, as well as the day and time that was selected. A green band will be drawn attempting to connect the upstream and downstream phases using the distance and default speed for each link between the intersections. Time is shown on the y-axis and distance is displayed on the x-axis. As the speed increases on a link, the slope of the green band decreases. Any intersections running free will show as a grey line in the time-space diagram. The green band will be shown as if the free intersection’s through phases are constantly being serviced.
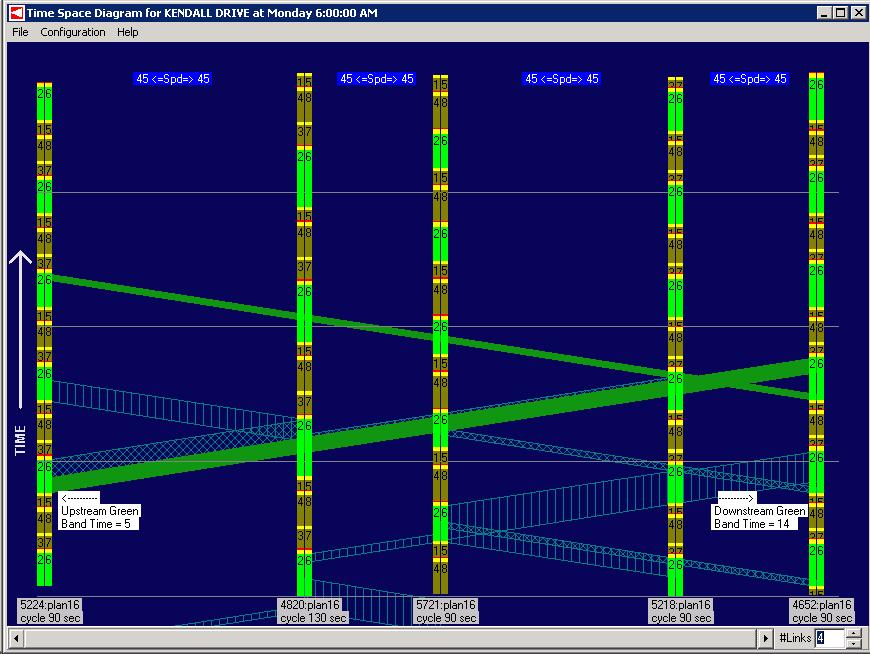

If a contiguous band extends through to the final intersection in the arterial, the contiguous band is highlighted in bright green. The vertical axis is time in seconds and the horizontal axis is distance in feet. Any band that is truncated is shown in cross hash marks. The user has the capability to show progression for links between intersections by turning on the link bands through the configuration menu item.
Link bands are shown by a vertical hashed band.
The user has the ability to define two movements per arterial. If the user has defined a secondary movement, they can be shown by turning on secondary movements through the configuration menu item. The secondary movement cross hash will be drawn into the next intersection’s downstream/upstream primary phase. If the additional band does not make it through any part of the next intersection’s upstream/downstream phase 1, the new cross hash will not be displayed. Clearance will not be included in the band or cross hash.
Annotations are overlaid on the green bands in each direction that indicates the size of the band in seconds. The bottom of each intersection vertical bar is annotated with the asset number, plan number, and cycle time of the intersection. The link speed of each link is shown at the top of the display.
The Time Space diagram will also show up to three repeating bands as shown in the image below.

¶ Modifying offset values
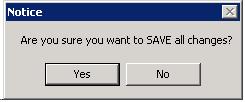
The offset for any intersection can be adjusted by clicking on the intersection, holding the mouse button down, and sliding the intersection up and down. The offset value will be displayed in the top left hand corner of the window. The user may modify offsets for multiple intersections before saving the changes. Once the user selects Save,
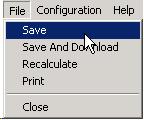

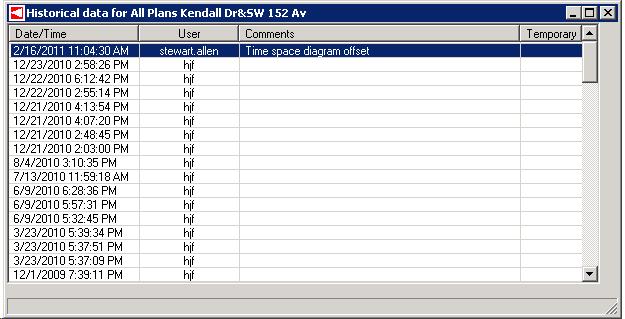
the Time Space diagram form will save all changes made to the offset parameters without displaying the coordination all plans page. A comment will automatically be inserted into history with the comment "Time space diagram offset". Additionally, if a user attempts to save and no changes were found, a popup will display that notifies the user.

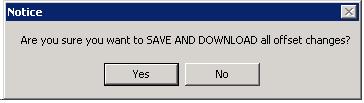
If the user selects Save And Download the Time Space diagram form will save all changes made to the offset parameters and download all changes made without displaying the coordination all plans page. A comment will automatically be inserted into history with the comment "Time space diagram offset". Additionally, if a user attempts to save and no changes were found , a popup will display that notifies the user.

A comment will be added automatically to the historical record that notifies the engineer that a change was made with Time-Space diagram save and/or download feature.


Modifying offsets is not supported on the Historical TSD Display, since it displays the actual realized green-time data.
¶ Configuring a Time-Space Diagram
Use the configuration menu on the TSD display to toggle on and off the following features:
Link bands
Upstream green bands
Downstream green bands
Secondary movement green bands
Green band annotations
Header and footer details
Show diagram on a white background (for printing)
¶ Zoom-in, zoom-out, and pan on Time-Space Diagram
Time space diagrams can be manipulated to be cover a smaller or larger number of intersections (“zoom in” and “zoom out”) and to change the extent of intersections shown on the display (“pan”). To change the number of intersections shown on the display, choose the up or down arrows on the bottom right corner of the display window, or just type the number of links that you wish to see on the display. In this example, 4 links are chosen and thus 5 intersections are shown on the display. As more and more intersections are shown, the width of the bars for each intersection will become narrower and less detail will be shown for each intersection including removal of labels and speed indications.

To pan the view to the left or right (upstream or downstream) on the arterial, press the left or right arrows at the bottom of the display window, or drag the scroll bar to the left or right. The display will pan to show different signals, but the total number will not change.
Time-space diagram displays are expandable. Drag the corners of the window to enlarge the view.
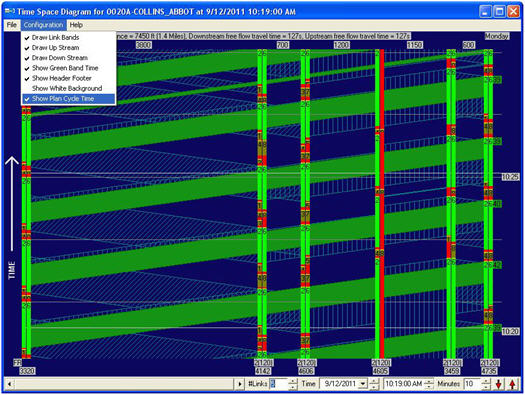
¶ Historical Time-Space Diagram
Time space diagrams can be displayed representing the actual performance of an arterial up to 30 days in the past. This display uses the “HIT” data retrieved from the field controllers. This TSD display is slightly different than the other TSD options, as shown in the example below. When progression is possible through all intersections on the screen, solid green bars will be drawn. Otherwise, vertical and skewed hatched patterns display the link bands between each intersection. The top of a historical TSD also displays the arterial name, the total distance shown on the display, and the upstream and downstream travel times. Both travel times assume traveling at the link speed and no stops at intersections.
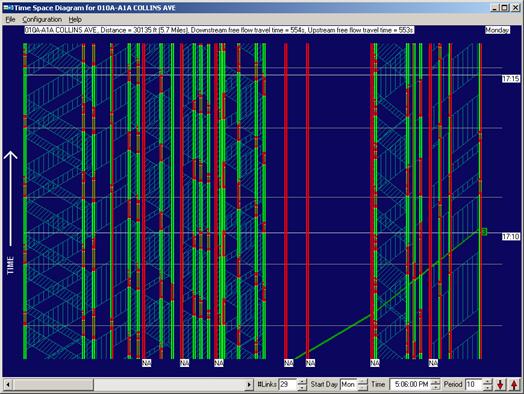


The historical TSD includes several additional display controls in the lower control bar.
| Control | Description |
| Time | Specifies the date and start time for the TSD. Use the up or down arrows to change the date or individual elements of the time (hour, minutes, seconds, and AM/PM) or type directly in the fields to change the time |
| Minutes | Specifies the number of minutes to display on the y-axis of the display. Use the up or down arrows to change the period or type directly in the text box to change the period. |
| Red up/down arrows | Press the red down arrow to display the previous period data or press the red up arrow to display the next period data. One fourth of the current period will be incremented or decremented from the begin time. For example, if the time is currently 5:00PM and the period is 10, pressing the up arrow will change the start time to 5:02:30PM and display the data for 5:02:30 – 5:12:30. Pressing again will show the data from 5:05:00 to 5:15:00. |
The historical TSD includes several additional annotations on the screen when there is room for display:
- Link distances are shown at the top
- Individual green-band widths are shown to the right and left of each band (black number with green background)
- Regular time intervals (15:00, 15:10, etc. are shown on the far right side)
- Plan number and cycle time are shown at the bottom of each intersection bar. The plan number and cycle applies to the first cycle and plan running during the time period (since it is possible for the historical TSD display to shown multiple timing plans on one screen, as well as the corresponding transition events between the two or more plans).
In addition, under the Configuration menu, Show Plan Cycle Time will display the programmed cycle length for the intersection (in parentheses beside the programmed plan number) when checked.
¶ Printing a Time-Space Diagram
To print a time-space diagram, select File on the menu bar and click print. The print selection dialog box will show the destination printer and allow you to select the print range, number of copies, and collate copies option.
¶ Right-click menu time-space diagram
Right-click on an intersection bar in a time space diagram to access the following options, as shown below:
- Links list
- Time-space diagram (will open a new diagram)
- Cycle Summary
These options are context sensitive to which intersection was selected - they will be for that specific intersection.